
Latest in-context #covid stats – England, UK, Trust and Local Area. Plus things to consider 👇🏼
⬇️ Other than Medway & Waltham Forrest, all other areas/counties in England have seen Positive Tests decrease fairly dramatically, as Rapid tests (Lateral Flow) start ramping.
🗯 Another strong indicator that PCR testing – especially testing those without any symptoms – is a #casedemic inducing tool.
You can check your local Area and/or Hospital Trust (England only) for case rates, deaths rates, rapid tests, covid patients, overall bed use and overall ICU use on the COVID+ Insights Dashboard.
👉🏼 Check it out: https://adapnation.io/covid-insights/
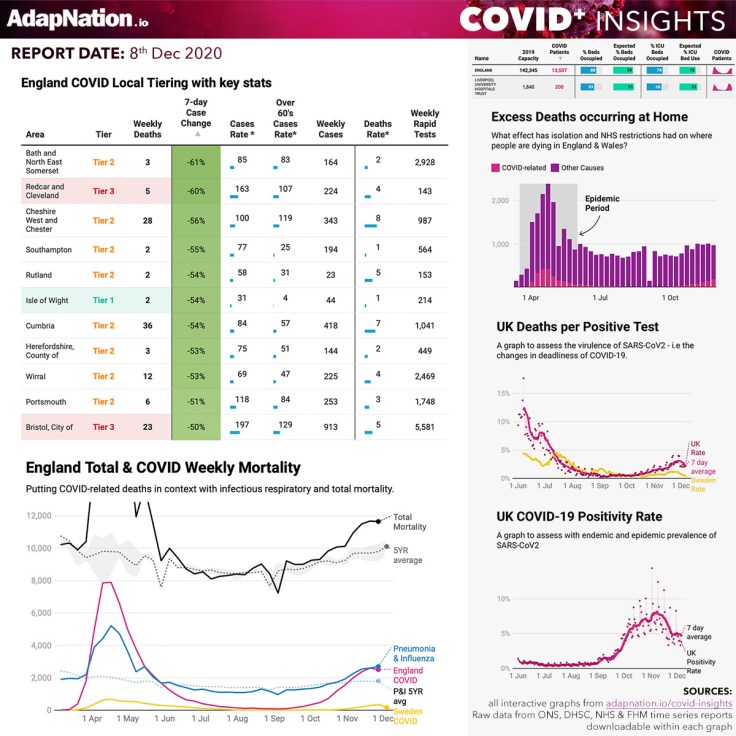
Down, down, down
🏥 As one example, Liverpool University Hosp Trust – the one that was to get overwhelmed and cause the Manchester Nightingale to get overwhelmed too – is at 69% General Occupancy and 68% ICU bed use.
⬇️ To be clear, that’s general use – all patients of all ailments. They are at 74% of last years occupancy figures for his time of the year.
⬇️ Positivity rates continue to drop, as does the Deaths to “Cases” ratio.
🚨 We continue to see an unacceptably significant excess Home deaths burden NOT due to COVID-19 – now at 32,426 since March.
↘️ It’s too early to tell, but it looks like the England Total Mortality and COVID-positive Mortality is starting to bend down too.
A knot that cannot be untangled
🥵 But… the analysis will continue to become even more difficult to draw conclusions from, as there are so many moving parts:
1️⃣ Is COVID-19 losing virulence as it has now settled into endemic equilibrium and effective herd immunity is close to being achieved?
2️⃣ As Govt use less sensitive tests (Lateral Flow), how do we assess test type/process changes vs effects from restrictions etc? How do we know if Ct levels are being increased/decreased?
3️⃣ How do we assess the impact of Intervention vs Lockdown-induced health decline and associated excess deaths – as this will increase total mortality?
4️⃣ As we layer in the COVID (and Flu) Vaccines, how do we assess the Benefits & Harms directly related to them?
5️⃣ The Flu Season is far from over. How do we parse out the normal winter effects from all of the above?
The shrouded vaccine effect
🎛 As you can see, it’s now an almost impossible task to attribute rises or falls in Total Mortality to anything… as all these dials are changing simultaneously.
💉 The most important to track right now is the effect of vaccines. The COVID+ Insights Dashboard tracks Excess/Total Mortality per age group – so we can focus on the the oldest groups right now.
But, things get even more muddy…
🤷🏻♂️ The short-term positive and negative effects of vaccines will not be understood immediately. We’re probably 4-5 weeks out (ie mid Jan at earliest) before we start seeing a positive signal, with the negative signal perhaps breaking earlier in the next couple weeks.
🤷🏻♂️ And then yet another dial will be what the govt decide to do regarding testing of the elder vaccine groups. Will they stop testing – thereby missing any negative vaccine signal as “non-Covid”?
🤯 Admittedly, this is giving me a headache.
🤓 If you have any bright ideas on how we can carefully monitor the positive and negative effect of vaccines using public data please let us know. 👇🏼
#FactsNotFear
SOURCES:
All original govt sources are listed, linked and raw data downloadable with each graph. Link in comment below. 👇🏼
🟢 COVID+ INSIGHTS DASHBOARD: https://adapnation.io/covid-insights/
🟢 TIER STATUS CHECK: https://adapnation.io/covid-insights-extra/

Enjoyed the read?Comment below, and check out our longer-form Articles, our shorter Micro Blog sections, grab Healthy Meal Ideas from AdapNation Food Diary, and Free Gym Workout Plans at #HyperWorkouts. |
Leave a comment